What is the Carbon Footprint of an Aluminum Can?
What is the Carbon Footprint of an Aluminum Can?
Disclosure: This post contains affiliate links. That means that if you click on one of them and make a purchase, I may earn a commission. Thank you for your support!
The carbon footprint of a product is an estimation of how much greenhouse gas impact that product has. It is calculated by looking at the entire process of extracting the materials needed to make it, to manufacturing it, to transporting it to stores, keeping it stored or refrigerated, and so on. I will probably be doing a series on the carbon footprints of common products, and I thought a good one to start with would be the carbon footprint of an aluminum can.
I’m assuming that you’re probably here because like most of us, you want to make the most eco-conscious, sustainable choices possible. And it’s really confusing to understand the full impact of those choices so that you can reduce your impact.
The Carbon Emissions of One Soda or Beer Can

The greenhouse gas (GHG) emissions of an aluminum can (minus the beverage itself) is about 150 – 1300 g CO2 equivalent per can. I used two different sources for these numbers, and the range of estimates are pretty wide, see footnotes*. This is likely due to the fact that extraction and manufacturing practices are widely varied by type of energy used (some use renewables like hydroelectric, others don’t), how much recycled content they contain and more.
But then you will most likely say, “Okay, so are those numbers good or bad?”
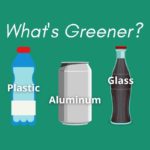
Because what you really want to know is, how bad is an aluminum can? And is plastic or glass better for the environment or worse? What should I choose when I go to the store?
The Environmental Impact of Drinks Packaging
I recently researched another article using some life cycle analysis studies of drinks packaging materials. In terms of GHG emissions only, glass is generally worst, followed by aluminum, then plastic. However, as with all environmental issues, things are more complicated than that. There are many other types of pollutants produced in the process of manufacturing packaging as well. Visit this article for a more in-depth discussion on the differences in environmental impact between glass, aluminum and plastic.
Keep in mind also that these rankings can change and vary based on your location, the manufacturers that supply a particular drink, changes in the industry (like increased recycling and use of renewable energy), and more. So it’s complicated and constantly evolving.
To learn more about the carbon impact of all sorts of lifestyle choices, products and foods that you consume and use everyday, I highly recommend an excellent book by Mike Berners-Lee called “How Bad Are Bananas? The Carbon Footprint of Everything.” (See link below.) It explains the carbon impacts of all our everyday choices and products in a clear, accessible way that helps you focus on what you should be most concerned about as you attempt to reduce your carbon footprint.

Want to calculate your own personal carbon footprint? I tested and reviewed some online carbon footprint calculators in this article.
* Data sourced from: Life Cycle Environmental Impacts of Carbonated Soft Drinks and Plastic Bottles vs Aluminum Cans, who’ll win the global water fight?.